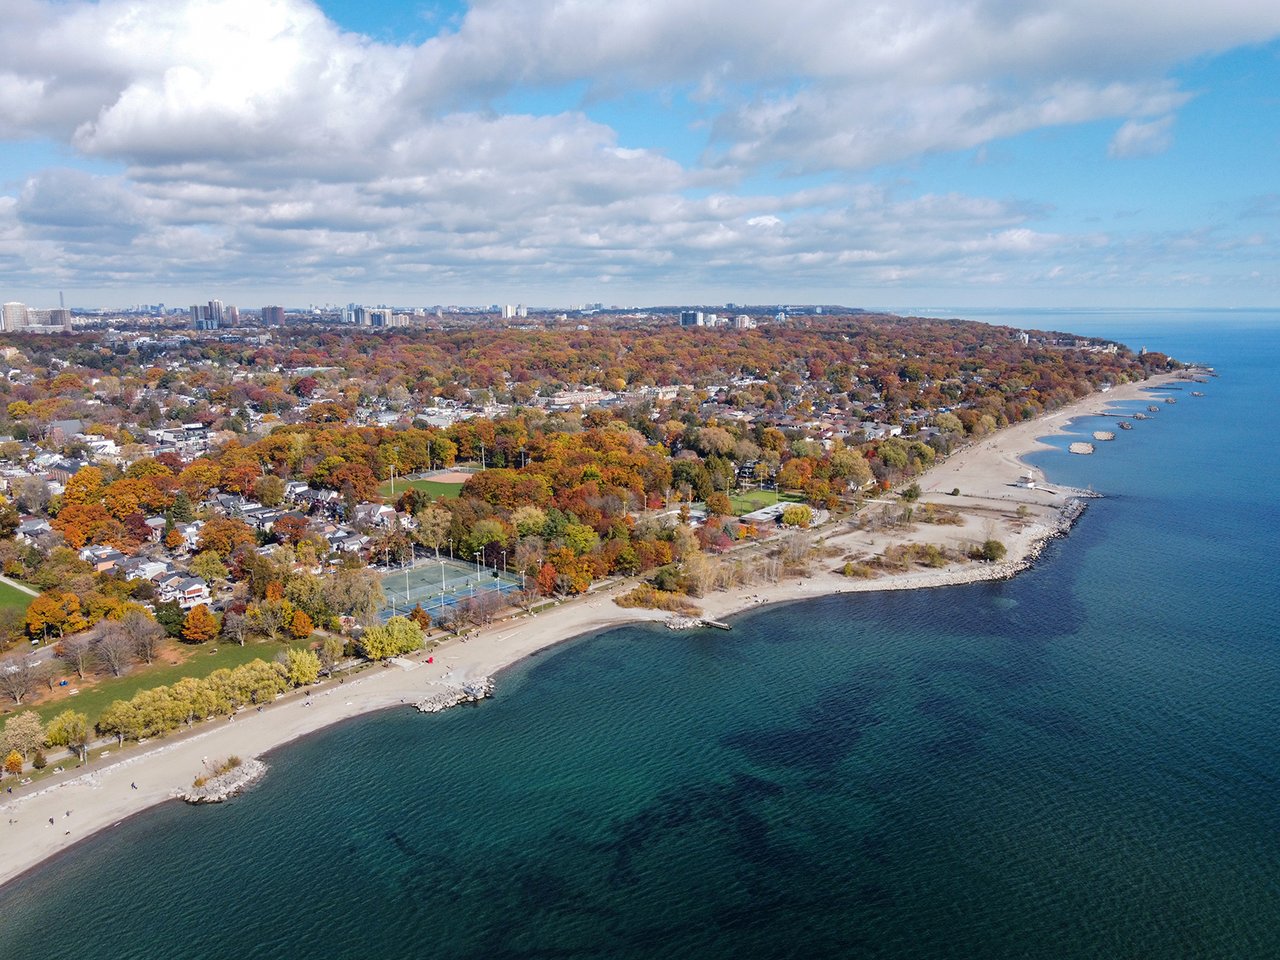
The east side of Toronto covers a lot of ground, from Leslieville and the Beaches to East York, the Golden Mile, Agincourt and the Rouge. It's right next door to Durham, and plenty of buyers compare the two before deciding where to look.
The Toronto Regional Real Estate Board (TRREB) released its September 2026 numbers on October 6. October figures won't be out until early November, so here's what the latest data shows for East Toronto, how the inner east compares with Scarborough, and how it all compares with Durham Region.
Which areas are we talking about?
TRREB splits the City of Toronto into West, Central and East. Toronto East is made up of 11 districts, E01 to E11 (TRREB community map):
- E01: Riverdale and Leslieville (North Riverdale, South Riverdale, Blake-Jones, Greenwood-Coxwell)
- E02: The Beaches, East End-Danforth and the Woodbine Corridor
- E03: East York and the Danforth (including Broadview North, Crescent Town, O'Connor-Parkview and Woodbine-Lumsden)
- E04 to E11: Scarborough, from Clairlea-Birchmount, Dorset Park and Wexford-Maryvale (E04) out to Malvern and the Rouge (E11)
East Toronto by the numbers: September 2026
All figures below are from TRREB's September 2026 Market Watch, released October 6, 2026 (TRREB Market Watch, Sept 2026, PDF).
Toronto East (E01 to E11), all home types:
- 481 sales
- Average price: $956,004, median $880,000
- 1,450 new listings, with 1,984 active listings at month end
- About 3.6 months of inventory, based on TRREB's trend measure
- Homes sold for 101% of list price on average
- An average of 29 days on market for the final listing (TRREB's "LDOM"), or 41 days when you count earlier listings of the same property ("PDOM")
"Months of inventory" is a rough measure of how long it would take to sell all the homes on the market at the current pace of sales. A lower number usually means a tighter market. Toronto East's 3.6 months was the lowest of TRREB's three Toronto areas in September (Toronto West was 4.4 and Toronto Central 5.1), and close to Durham Region's 3.5.
So far this year (January to September 2026), Toronto East has recorded 4,217 sales at an average price of $949,586, with homes selling for 102% of list price on average.
The inner east vs. Scarborough
The east side isn't one market. Here's how September looked district by district:
District | Sales | Average price | Median price | Months of inventory | Sold vs. list price |
|---|---|---|---|---|---|
E01 Riverdale / Leslieville | 64 | $1,223,544 | $1,221,500 | 2.4 | 109% |
E02 The Beaches | 41 | $1,395,051 | $1,275,000 | 2.3 | 105% |
E03 East York / Danforth | 66 | $1,122,091 | $1,029,750 | 2.7 | 100% |
E04 Clairlea / Dorset Park / Wexford | 52 | $781,534 | $812,500 | 3.7 | 99% |
E05 L'Amoreaux / Steeles / Tam O'Shanter | 39 | $788,353 | $738,000 | 3.8 | 99% |
E06 Birchcliffe-Cliffside / Oakridge | 26 | $923,925 | $770,000 | 4.2 | 99% |
E07 Agincourt / Milliken | 39 | $748,644 | $778,000 | 3.6 | 101% |
E08 Cliffcrest / Guildwood / Scarborough Village | 36 | $900,617 | $803,000 | 5.4 | 97% |
E09 Bendale / Woburn / Morningside | 47 | $685,353 | $770,000 | 4.6 | 99% |
E10 Highland Creek / West Hill / Rouge | 43 | $946,392 | $940,000 | 3.8 | 97% |
E11 Malvern / Rouge | 28 | $726,530 | $685,000 | 5.0 | 99% |
A few things stand out:
- The inner east is still competitive. E01, E02 and E03 each had under three months of inventory, and homes in Riverdale and Leslieville (E01) sold for 109% of list price on average. Semi-detached homes in E01 sold for 113% of list price on average (28 sales).
- Scarborough has more choice. Combined, the eight Scarborough districts (E04 to E11) recorded 310 sales at an average of roughly $807,000, about $150,000 below the Toronto East average (my calculation from TRREB's district figures). Most Scarborough districts had between 3.6 and 5.4 months of inventory, and homes generally sold at or just below list price.
- Small samples move around. With 26 to 66 sales per district, one or two higher-priced sales can shift an average noticeably. That's why the median and the benchmark (below) are worth a look too.
Prices by home type across Toronto East
From the same TRREB release, for all of Toronto East in September:
- Detached: 249 sales, an average price of $1,115,178 (median $945,000), 825 active listings, 100% of list price, 28 days (LDOM)
- Semi-detached: 72 sales, an average price of $1,126,470 (median $1,052,500), 108% of list price, 21 days (LDOM)
- Freehold townhouses (att/row): 32 sales, an average price of $877,731 (median $769,250), 102% of list price
- Condo townhouses: 23 sales, an average price of $687,209 (median $652,000), 98% of list price
- Condo apartments: 100 sales, an average price of $537,948 (median $461,250), 659 active listings, 97% of list price, 36 days (LDOM)
Semi-detached homes were the tightest segment on the east side, while condo apartments had the most supply relative to sales.
Benchmark prices: how values have moved in a year
Averages depend on which homes happen to sell in a given month. The MLS® Home Price Index (HPI) tracks the price of a "typical" home instead, so it's a better way to see the trend. Here are September 2026 benchmark prices and the change from September 2025 (TRREB MLS® HPI Public Tables, Sept 2026):
Area | Composite benchmark | Change vs. Sept 2025 | Detached benchmark | Change vs. Sept 2025 |
|---|---|---|---|---|
E01 | $1,032,000 | −4.26% | $1,382,900 | −7.39% |
E02 | $1,248,400 | −2.65% | $1,605,100 | −3.28% |
E03 | $1,016,900 | −5.82% | $1,171,800 | −5.98% |
E04 | $706,800 | −8.81% | $861,700 | −9.92% |
E05 | $761,300 | −5.16% | $1,081,100 | −4.66% |
E06 | $901,200 | −7.11% | $991,800 | −8.37% |
E07 | $715,200 | −6.58% | $1,038,900 | −5.52% |
E08 | $782,900 | −8.10% | $986,800 | −9.89% |
E09 | $697,500 | −7.70% | $877,800 | −7.90% |
E10 | $883,600 | −5.16% | $1,010,000 | −6.98% |
E11 | $653,600 | −9.54% | $927,300 | −7.22% |
City of Toronto | $908,200 | −3.84% | $1,417,600 | −4.48% |
Durham Region | $805,600 | −5.20% | $883,700 | −5.11% |
Every east-end district is below last year's benchmark. The Beaches (E02) saw the smallest composite drop, while several Scarborough districts, including E04, E08 and E11, saw declines of 8% or more. Most Scarborough districts fell more than Durham Region did as a whole.
How East Toronto compares with Durham
For context, from the same TRREB release:
- Durham Region: 552 sales, an average price of $828,141 and a median of $770,000, with about 3.5 months of inventory. Homes sold for 98% of list price in an average of 30 days (48 days PDOM).
- City of Toronto: 1,937 sales, an average price of $1,034,320 and a median of $810,000, with about 4.6 months of inventory.
- All of TRREB's market area: 5,040 sales, down 9.0% from September 2025, and an average price of $1,006,409, down 5.1%. TRREB said homebuyers were "in a holding pattern" in September because of uncertainty about the economy, inflation and borrowing costs.
In short, Scarborough's typical prices sit fairly close to Durham's, while the inner east (E01 to E03) remains one of the more competitive parts of the city.
What this means if you're buying or selling on the east side
These are general observations, not predictions. Every street and every home is different.
- For buyers: If you've been priced out of Leslieville or the Beaches, Scarborough and Durham offer more choice at lower benchmark prices. Comparing a few districts side by side, with a pre-approval in hand, helps you see where your budget goes furthest.
- For sellers in the inner east: Homes, especially semis, are still selling above list on average. Pricing and preparation still matter, because buyers are comparing carefully.
- For sellers in Scarborough: With more inventory and benchmark prices below last year's, the gap between 29 days (final listing) and 41 days (including earlier listings) across Toronto East is a reminder that getting the price right the first time can save weeks.
- For owners staying put: It's worth knowing where your home stands, whether you're renovating, refinancing or renewing your mortgage in the next year.
New in the neighbourhood: Crosstown Craft BBQ on Comstock Road
On a lighter note, Scarborough is getting a new barbecue spot. Crosstown Craft BBQ, a barbecue pop-up that started in East York in 2025, is opening its first restaurant at 51 Comstock Rd. in Clairlea-Birchmount (E04). blogTO reports the doors open November 7, with weekend specials like beef ribs on Saturdays and picanha on Sundays (blogTO). Very Toronto notes that regular hours hadn't been posted yet, so check the restaurant's Instagram before you go (Very Toronto).
Curious what your east-end home is worth?
If you own in East Toronto, Scarborough or anywhere in Durham, message or email me at [email protected] and I'll put together a free Home Value Report for you. It's my opinion of value based on recent nearby sales, not an appraisal, and there's no obligation. If you're buying, ask me for my Buyer's Guide, which walks you through the process step by step.
Andrew Persaud, Sales Representative, REVEL Realty Inc., Brokerage #200B – 1032 Brock Street S, Whitby, ON L1N 4L8 📞 m 416.220.7045 | o 905.357.1700 ✉️ [email protected] 🌐 https://homesbyandrew.ca/
Market figures are from TRREB's September 2026 Market Watch and MLS® Home Price Index (released October 6, 2026) and refer to TRREB's Toronto East area and districts E01 to E11, the City of Toronto, Durham Region and the TRREB market area as a whole. They may not reflect any individual property or neighbourhood. Information is believed reliable but not guaranteed. A Home Value Report is an opinion of value, not an appraisal. Business details come from the sources linked and may change; inclusion is not an endorsement. Not intended to solicit buyers or sellers currently under contract with a brokerage.
Sources (checked November 2, 2026)
- TRREB Market Watch, September 2026 (released Oct 6, 2026), summary page plus Toronto East and district tables for all home types, detached, semi-detached, att/row/townhouse, condo townhouse, condo apartment and year-to-date: https://trreb.ca/wp-content/files/market-stats/market-watch/mw2609.pdf
- TRREB MLS® HPI Public Tables, September 2026: https://trreb.ca/wp-content/files/market-stats/home-price-index/TRREB_MLS_HPI_Public_Tables_0926.pdf
- TRREB Toronto community map (district boundaries): https://app.trreb.ca/trrebdata/common/maps/Toronto.pdf
- blogTO, Crosstown Craft BBQ (Oct 2026): https://www.blogto.com/eat_drink/2026/10/crosstown-craft-bbq-toronto-opening/
- Very Toronto, Crosstown Craft BBQ: https://www.verytoronto.com/places/crosstown-craft-bbq
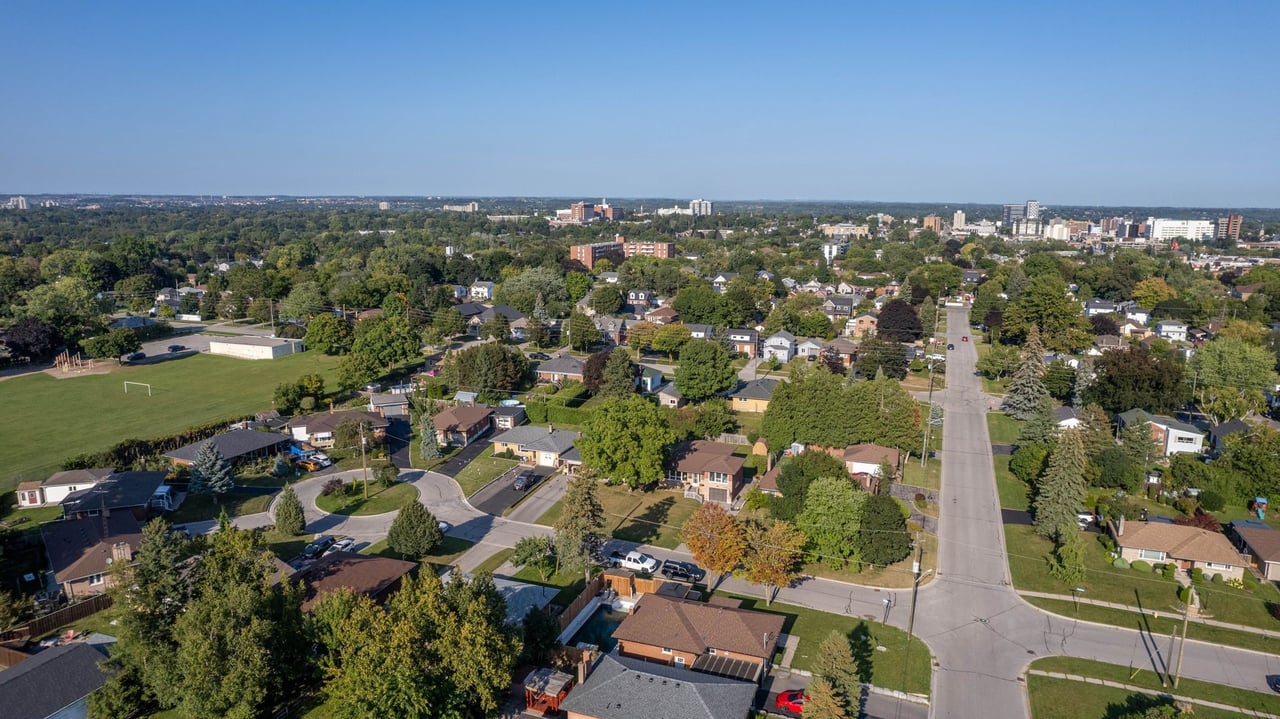
Header photo: "The Beaches aerial view 2023" by Canmenwalker, licensed under CC BY 4.0.